JARO is the official journal of the Association for Research in Otolaryngology (ARO). As such, JARO shares similar principles and core values as ARO, by promoting rigorous science, embracing diversity, inspiring integrity, encouraging collaboration, and supporting education. JARO is a peer-reviewed journal that aims at publishing research topics presented at the Annual ARO Mid-Winter Meeting, on the auditory and vestibular systems.
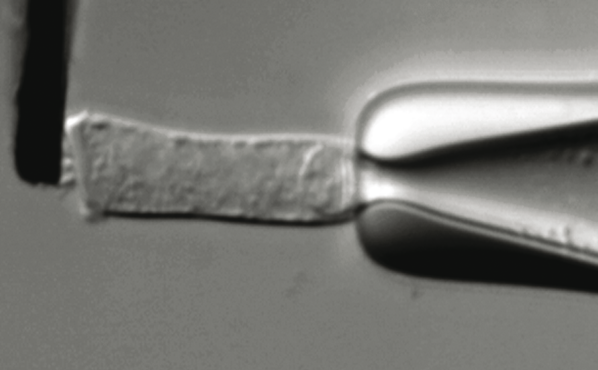
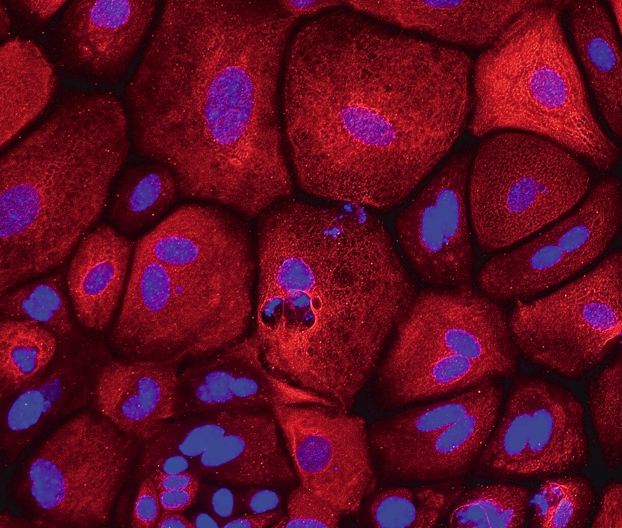
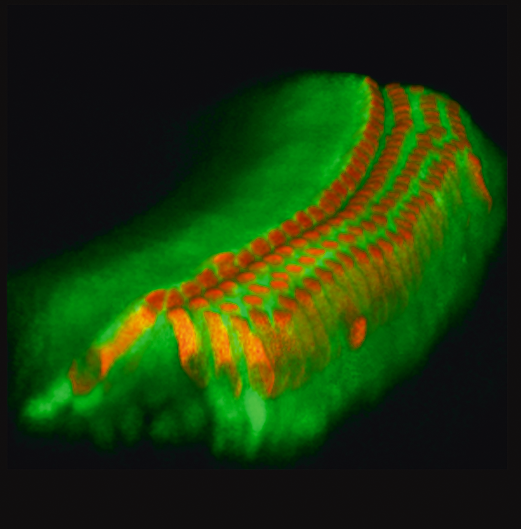
JARO welcomes submissions describing original experimental research that investigates the mechanisms underlying problems of basic or clinical significance. Example of research areas include (but are not only restricted to): molecular biology, genetics related to hearing and balance mechanisms, biochemistry, cochlear anatomy and physiology, opto- and chemo-genetics, vestibular anatomy and physiology, electrophysiology, middle ear anatomy and modeling, mechanotransduction, computational central anatomy, behavior and physiology, psychoacoustics in normal and hearing-impaired subjects, and studies of hearing perception in cochlear implant patients.
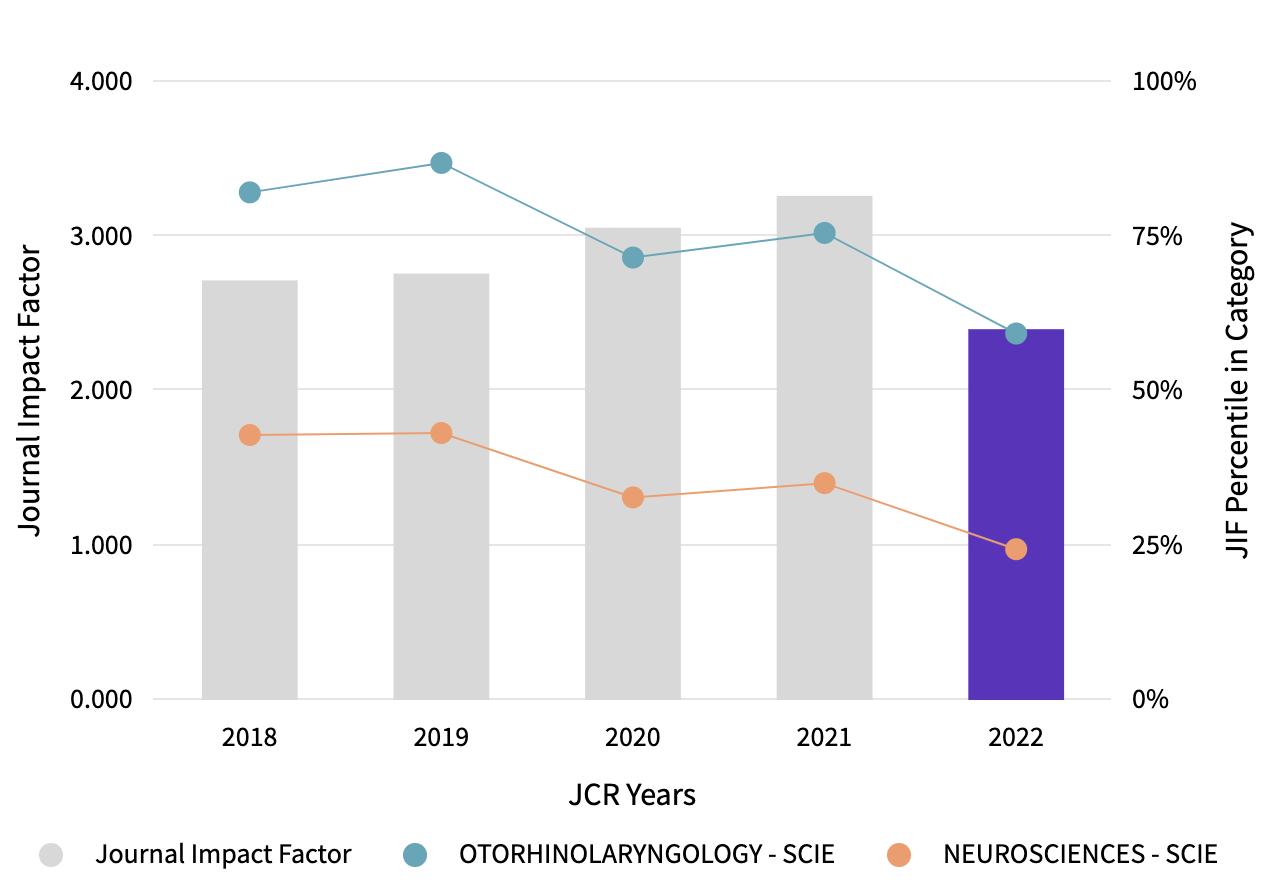
Journal Impact Factor
The Journal Impact Factor (JIF) is a journal-level metric calculated from data indexed in the Web of Science Core Collection. It should be used with careful attention to the many factors that influence citation rates, such as the volume of publication and citations characteristics of the subject area and type of journal. The Journal Impact Factor can complement expert opinion and informed peer review. In the case of academic evaluation for tenure, it is inappropriate to use a journal-level metric as a proxy measure for individual researchers, institutions, or articles.
Journal Impact Factor Trend 2022
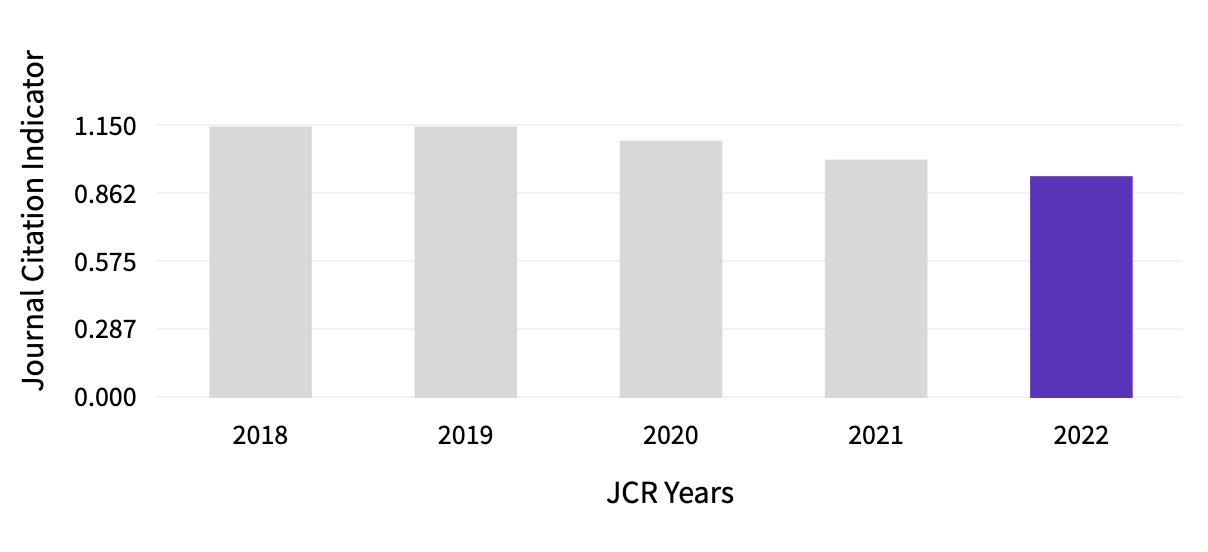
Journal Citation Indicator (JCI)
The Journal Citation Indicator (JCI) is the average Category Normalized Citation Impact (CNCI) of citable items (articles & reviews) published by a journal over a recent three year period. The average JCI in a category is 1. Journals with a JCI of 1.5 have 50% more citation impact than the average in that category. It may be used alongside other metrics to help you evaluate journals.
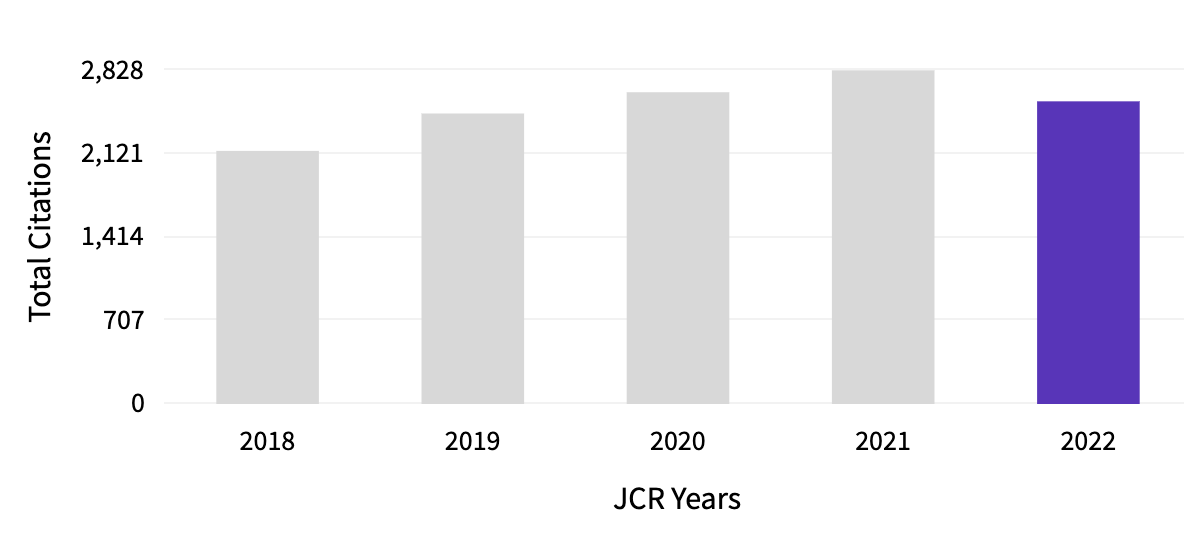
Total Citations: 2,828
The total number of times that a journal has been cited by all journals included in the database in the JCR year. Citations to journals listed in JCR are compiled annually from the JCR years combined database, regardless of which JCR edition lists the journal.
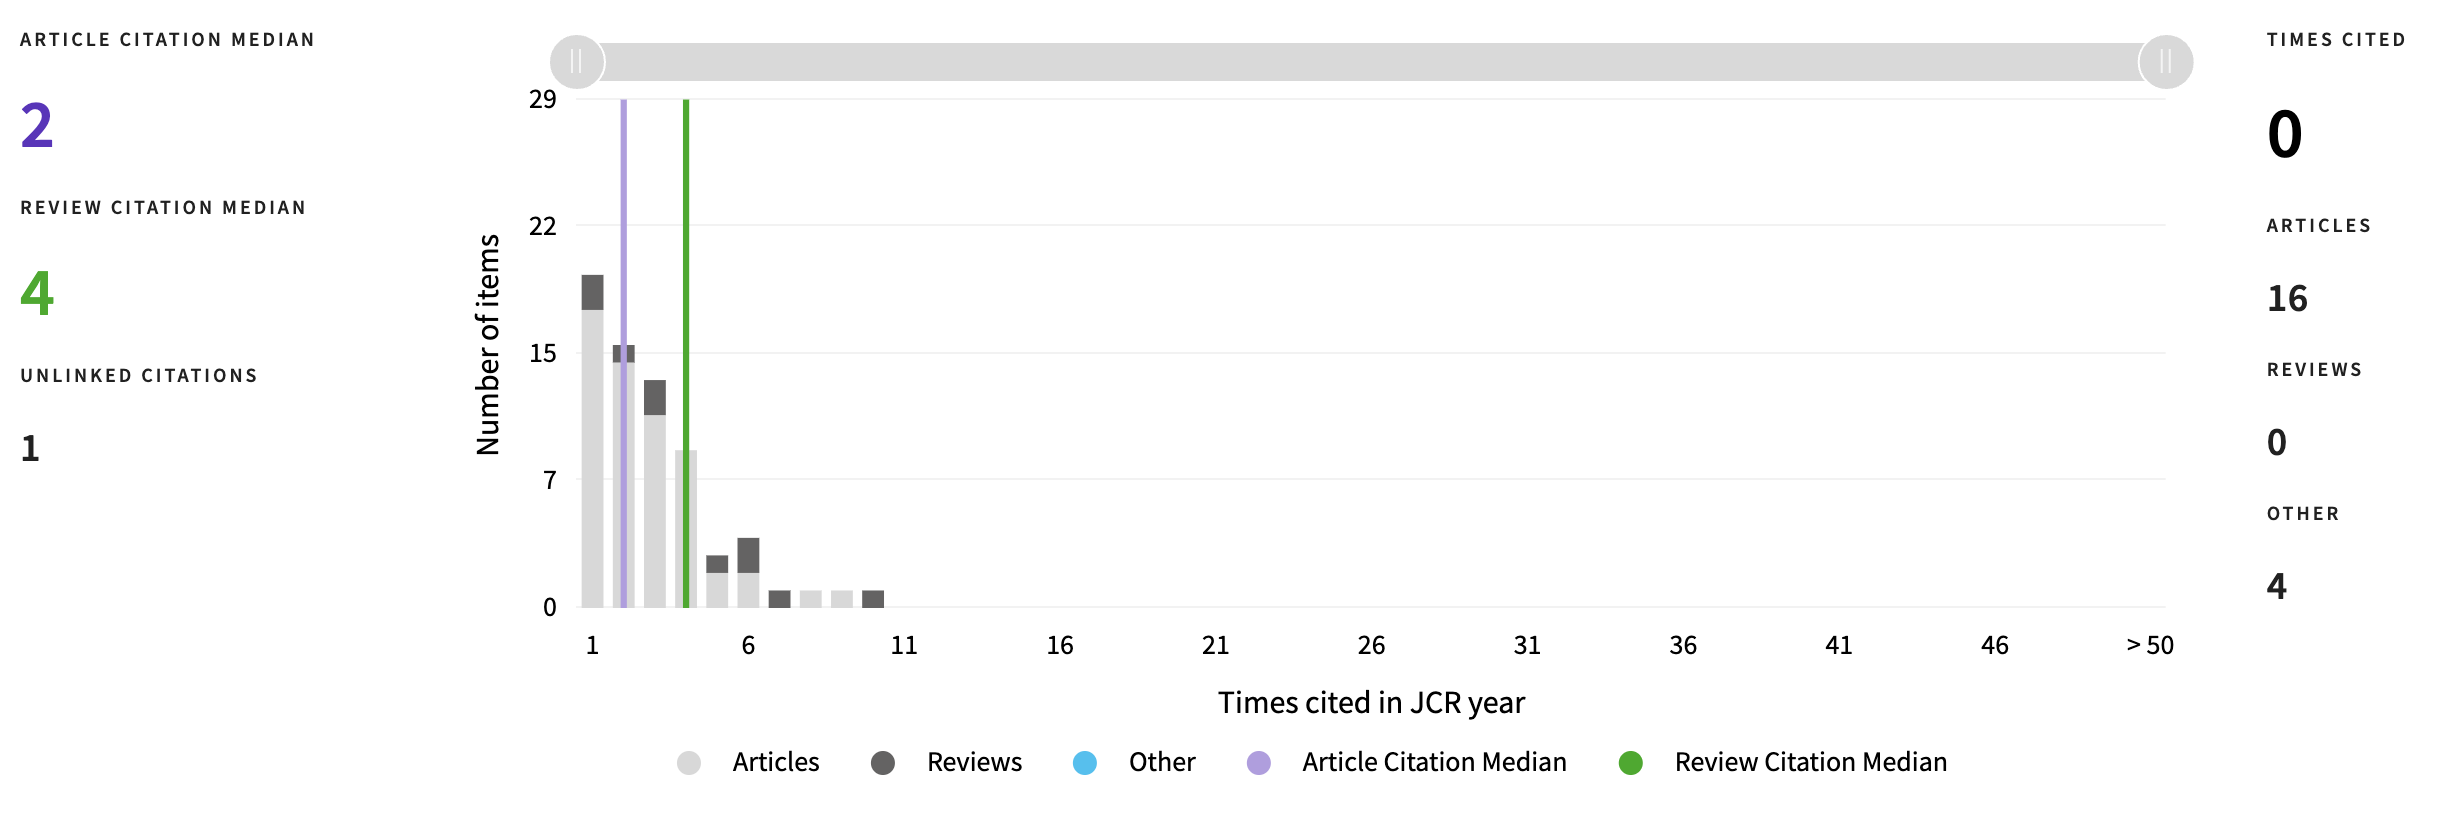
Citation Distribution
The Citation Distribution shows the frequency with which items published in the year or two years prior were cited in the JCR data year (i.e., the component of the calculation of the JIF). The graph has similar functionality as the JIF Trend graph, including hover-over data descriptions for each data point, and an interactive legend where each data element's legend can be used as a toggle. You can view Articles, Reviews, or Non-Citable (other) items to the JIF numerator.
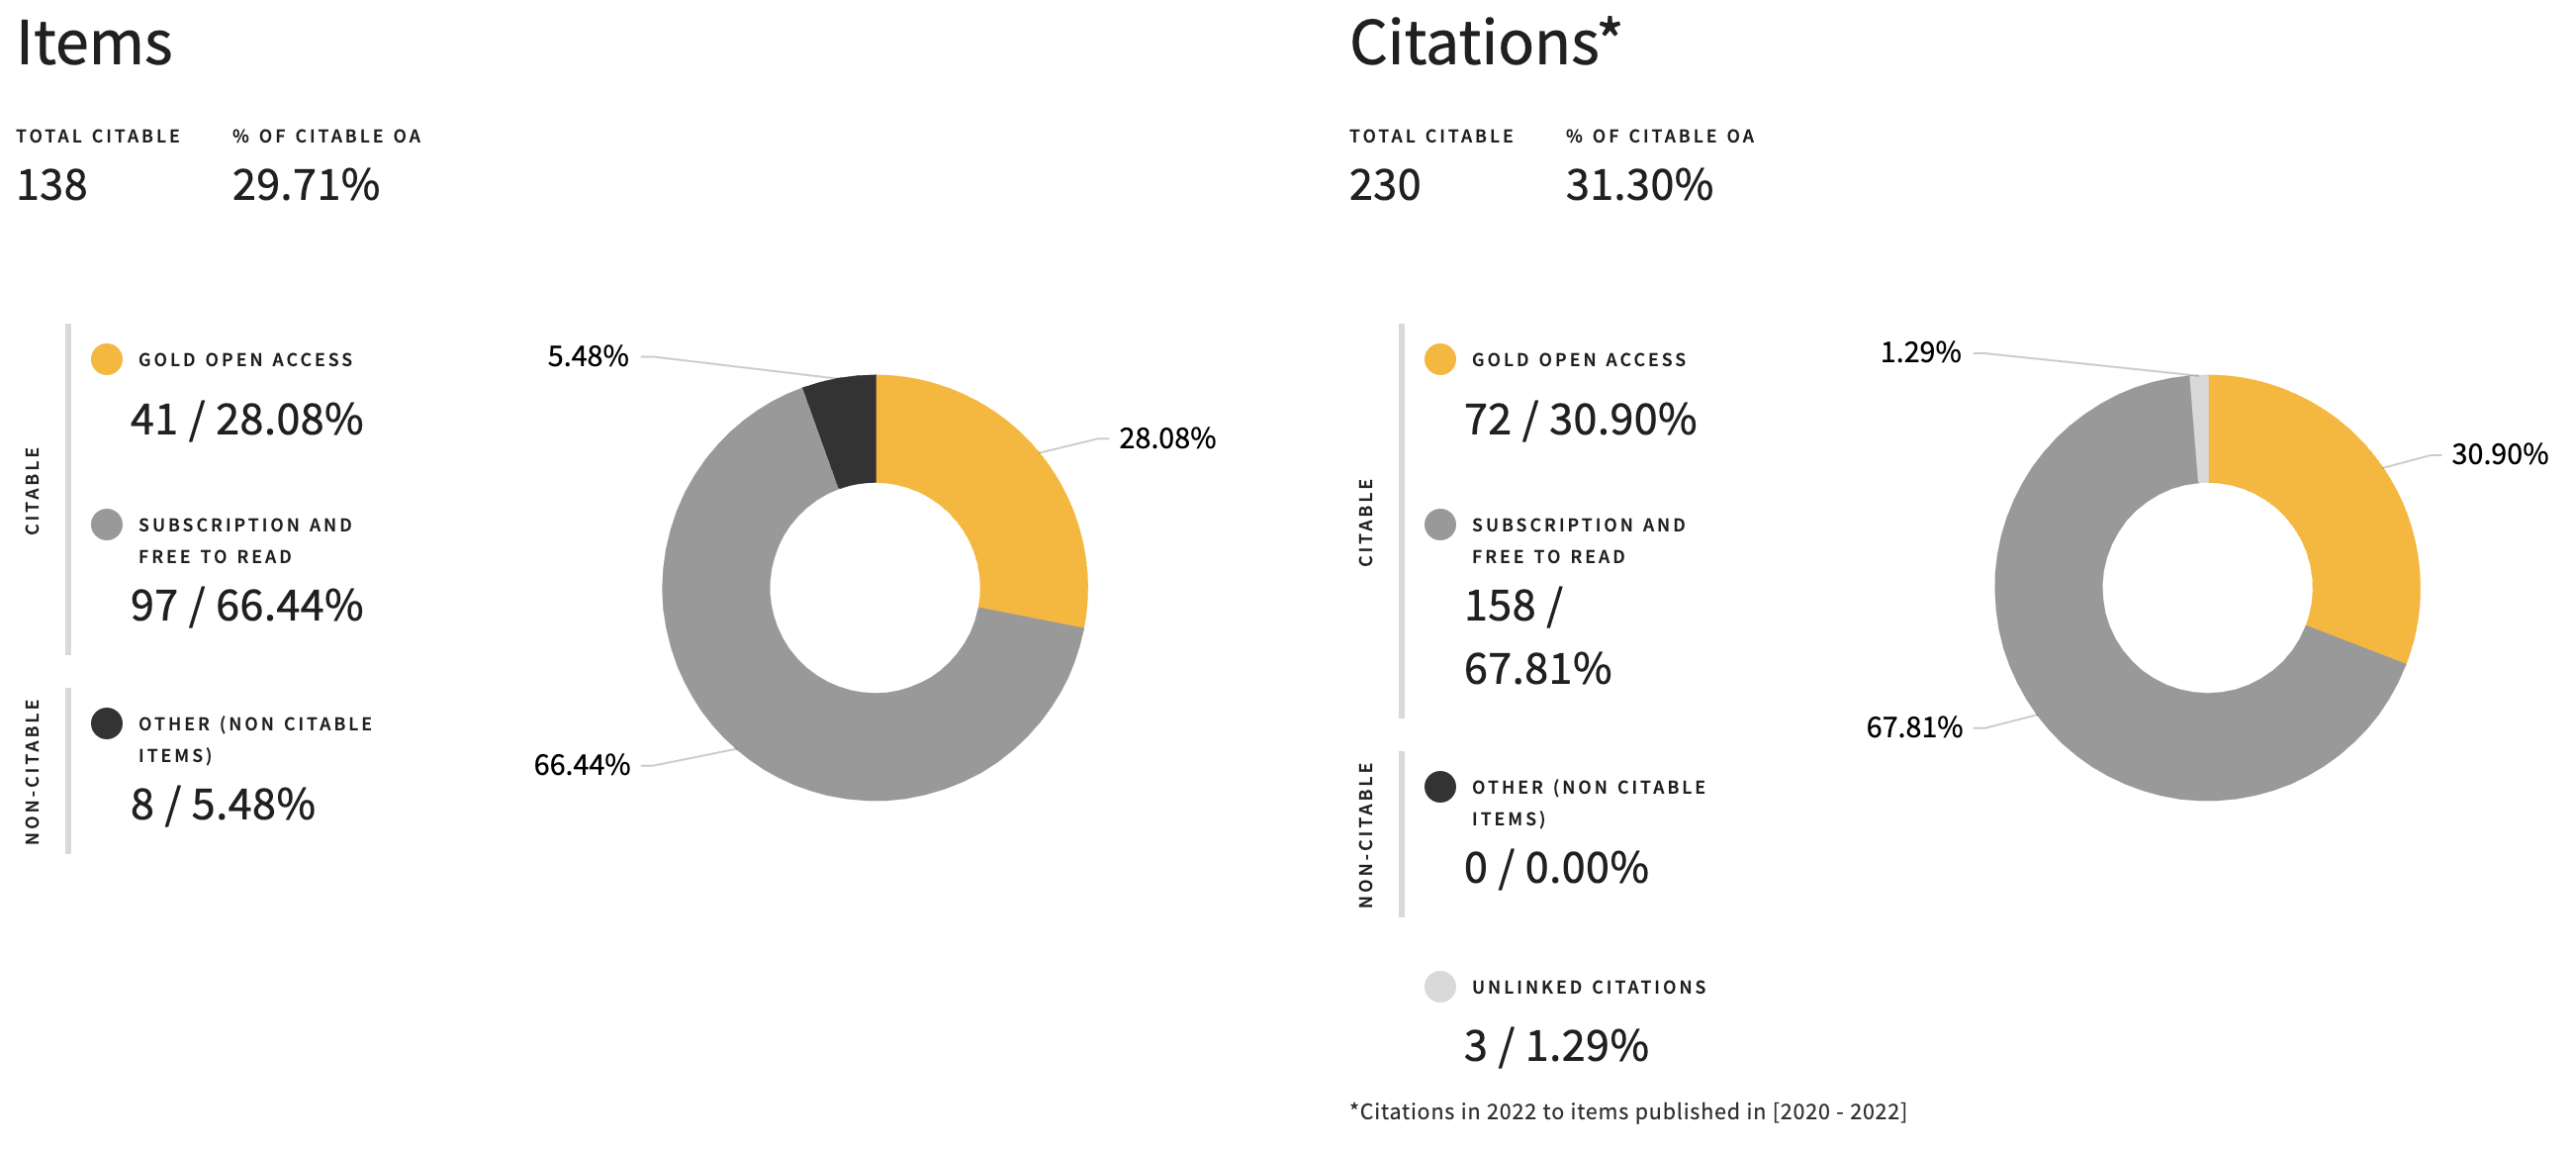
The data included in this tile summarizes the items published in the journal in the JCR data year and in the previous two years. For example, in the 2020 JCR data, released in June 2021, the Open Access (OA) data show the publication model (Gold OA or subscription) of materials published in 2018, 2019 and 2020, and citations in 2020 to these items. This three-year set of published items is used to provide descriptive analysis of the content and community of the journal.